Win rate (in %)*
Description
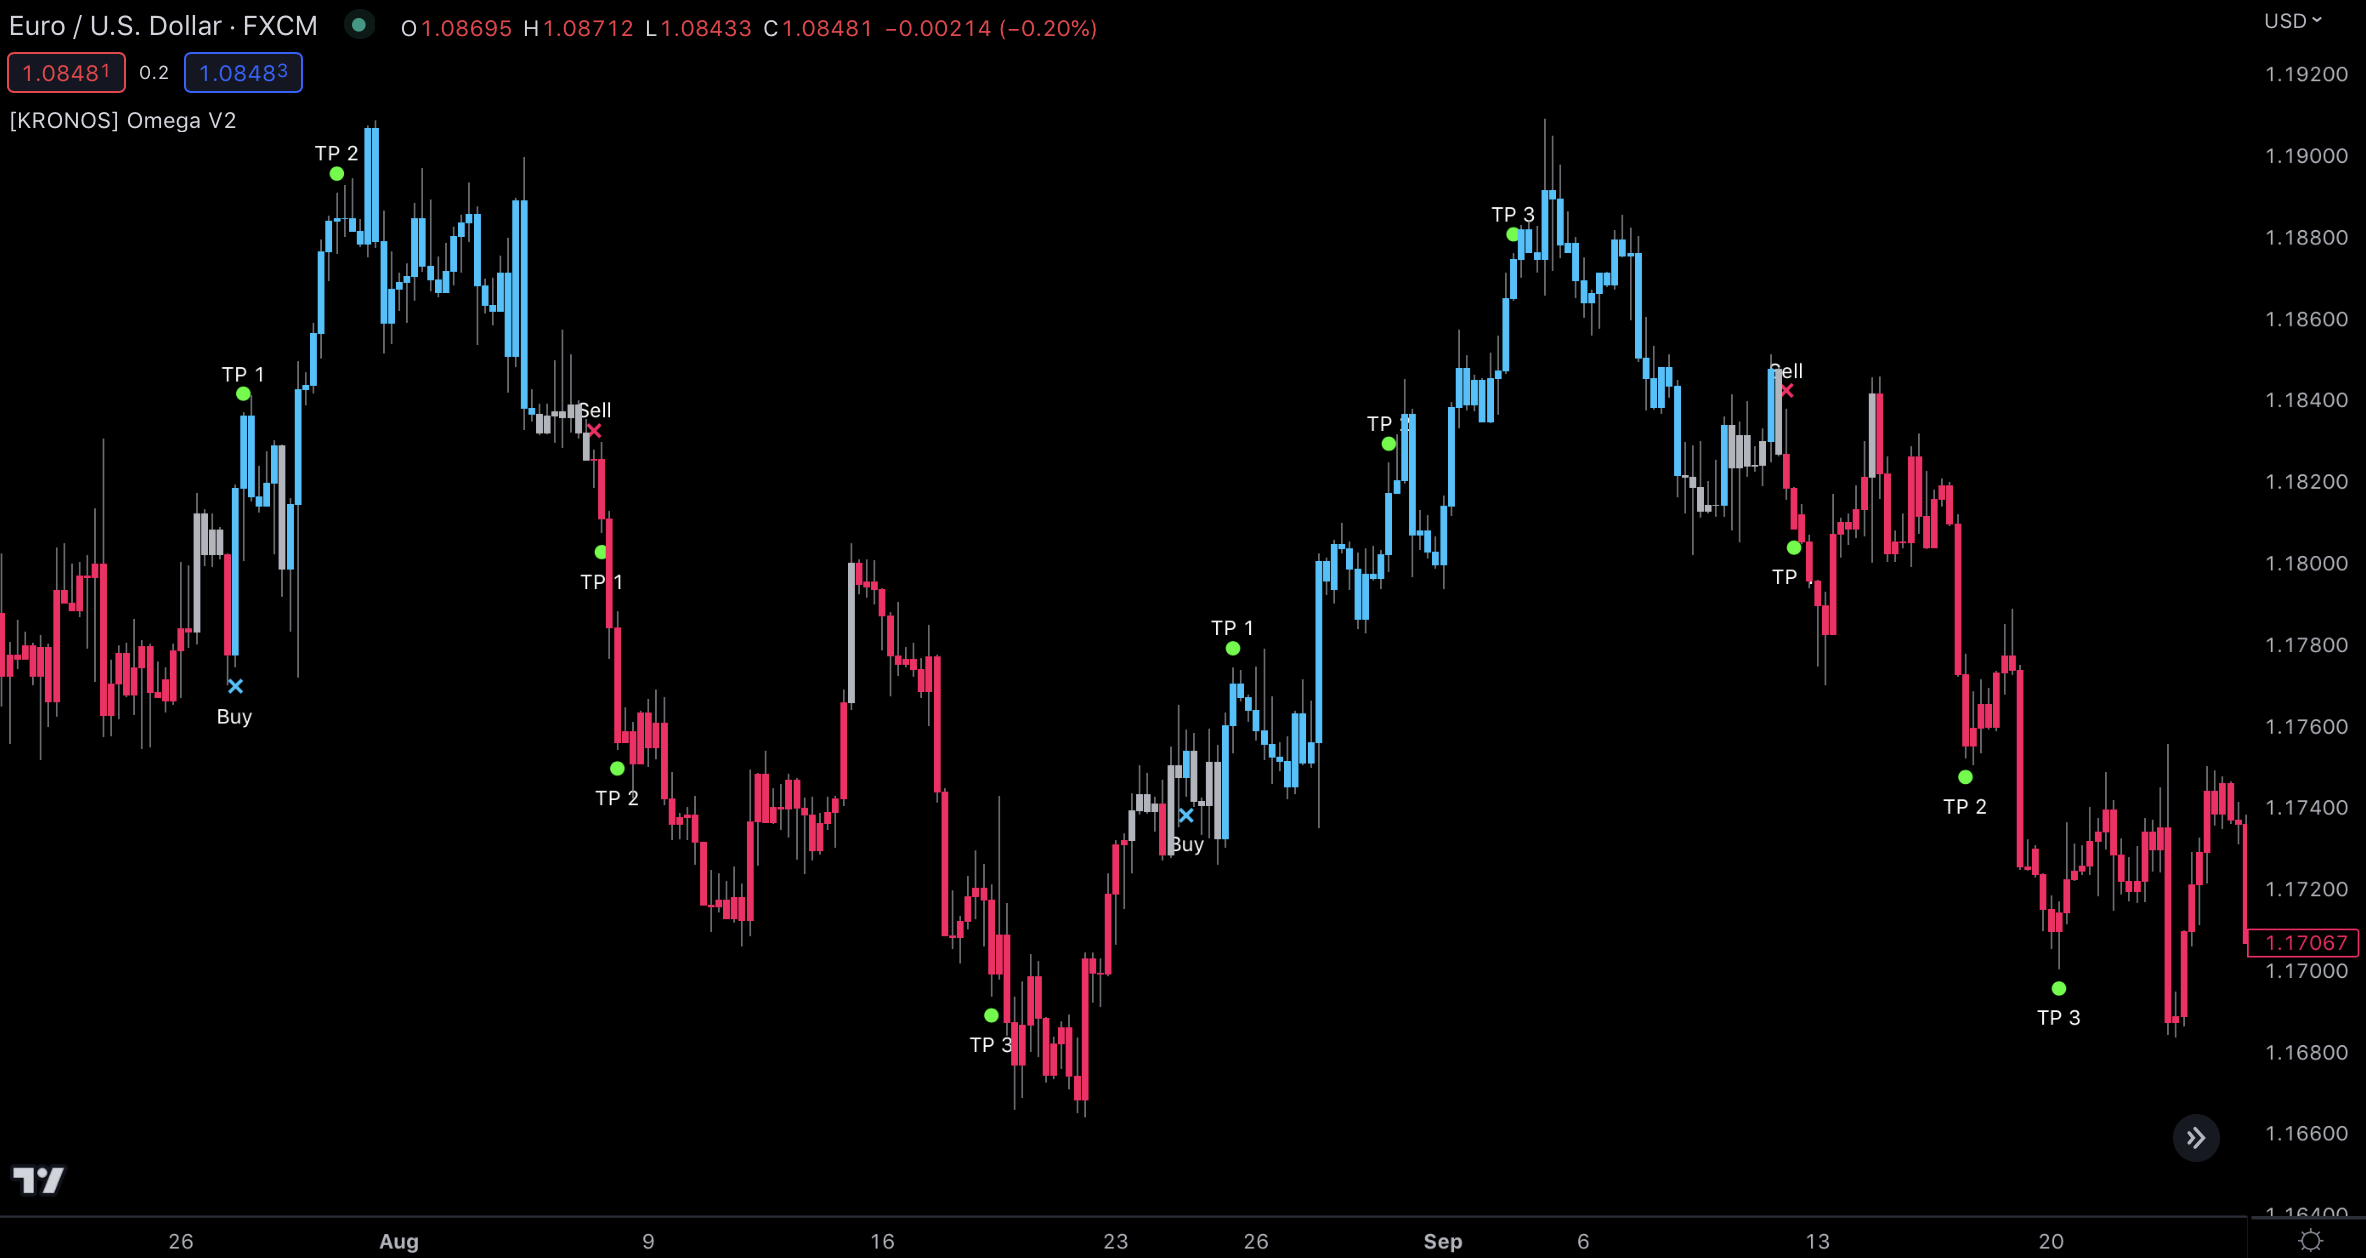
This indicator is applied directly on the chart and highlights a trend line which often acts as support or resistance, and can therefore be used as a trend reversal point or as a breakout wall. It includes
Support / Resistance. The colored band around the trend line can act as a potential area for reversals. Strength. A colored arrow under or over the trigger candle is showing points of the potential start of an extended trend in price. Confirmation. The band color and the arrows act as confirmation in order to enter a trade. Visualization. This indicator also offers a custom band coloring for easier trend recognition. How to use? Breakout trades (more risky):
Buy/Long when the indicator displays a blue arrow and the band color is blue. Sell/Short when the indicator displays a red arrow and the band color is red. Retest trades (less risky):
Buy/Long when the price (candle) drops into the band, that the band remains blue, while the candle can be either blue or gray. Sell/Short when the price (candle) rises into the band, that the band remains red, while the candle can be either red or gray. Who is this for? o o / o o o Recommended timeframe M / H Recommended market Crypto, Equities, Indices
*win rate is calculated based off a risk reward ratio of 1 (1R)
Win rate (in %)*
Description
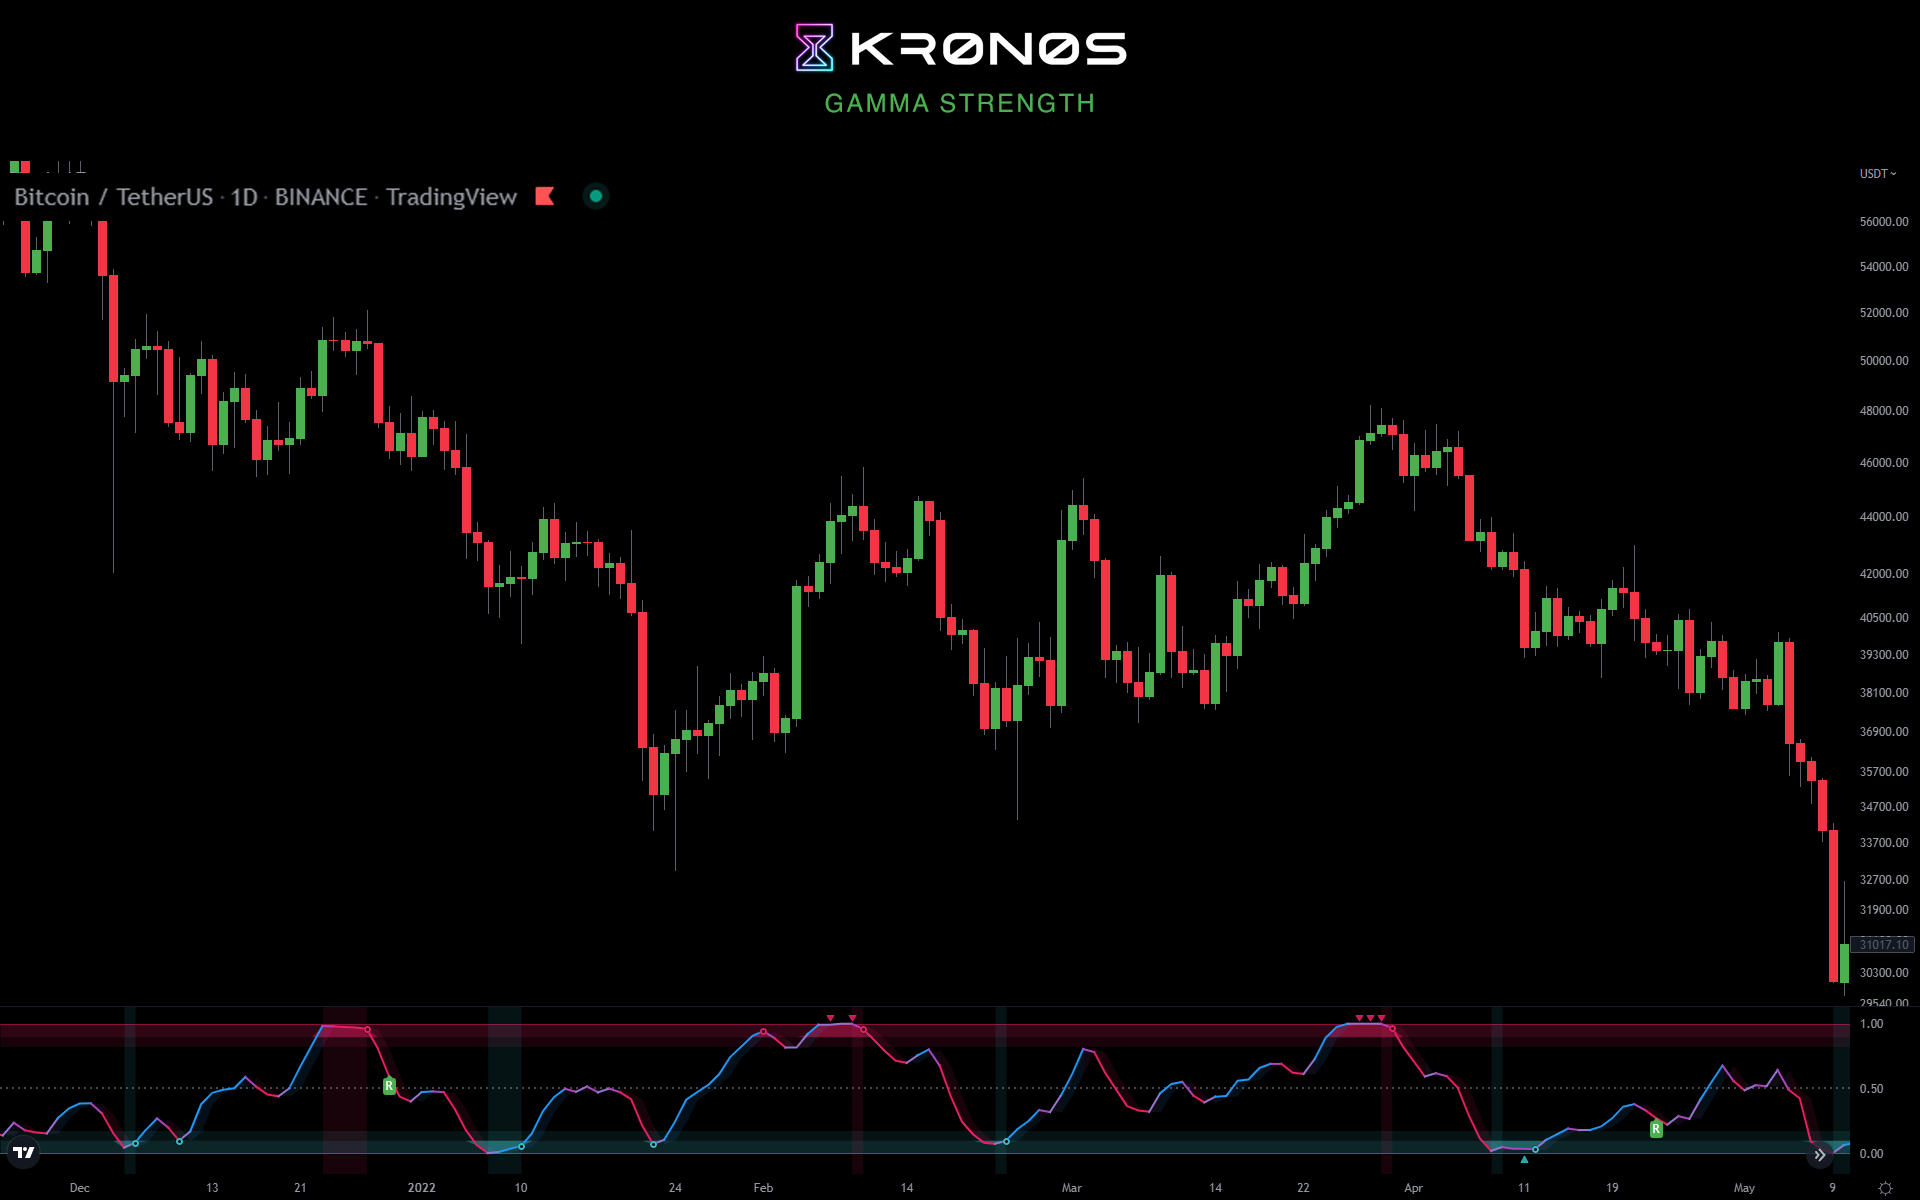
This indicator's main component is the signal line which represents a very responsive market strength value calculated from real time data and normalized into a range (0 - 0.5 - 1). It includes
Divergence. Indicator plots R for regular divergence and H for hidden with minimal possible delay which can be used to notice irregularity in the market. Extreme overbought and oversold areas. Colored background extreme areas are showing points where a reversal is approaching. How to use?
Buy/Long when the indicator line goes out of the blue/oversold area. Sell/Short when the indicator line goes out of the red/overbought area.
extra tip: you can use the zero line and overbought/oversold zones as either a take profit or an entry area. Who is this for? o o o Recommended timeframe M / H / D Recommended markets Crypto, Forex, Equities, Indices
*win rate is calculated based off a risk reward ratio of 1 (1R)
Win rate (in %)*
Description
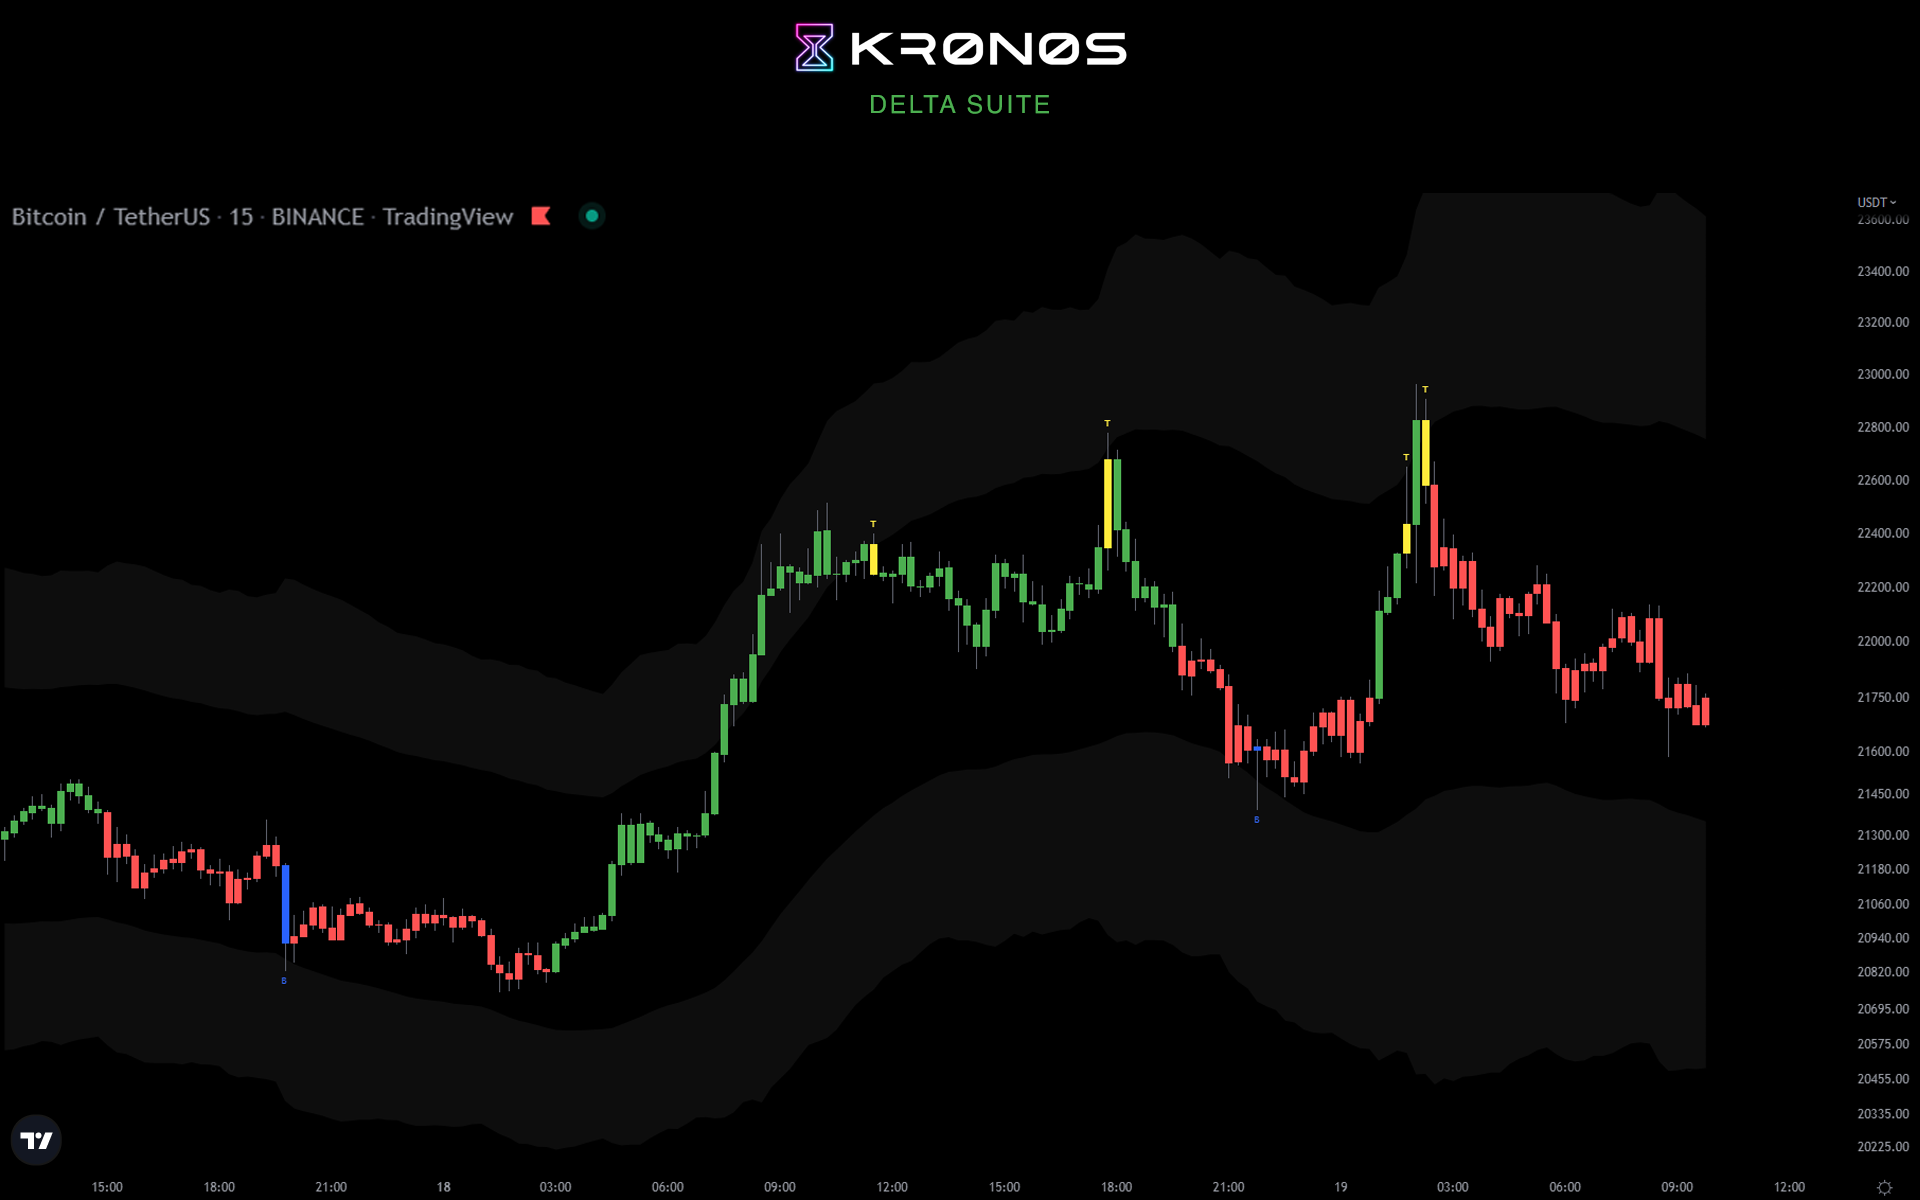
This indicator calculates the volume through defined periods of time and uses the current state of momentum in the market. It includes
Colored candles. They are reflecting the ongoing trend direction and provide traders with better clarity to end up on the right side of the trade. Trend reversals. If you see the letter T or B and a change of colored candles there is a high potential of reversal. Extreme zone. If the price is in the cloud then it is an indication to trade with caution. How to use?
Buy/Long at the start of a green candle if we are trading above local support Sell/Short on the start of red candles if we are trading below local resistance Take profit on top reversal signals Take profit on bottom reversal signs Who is this for? o / o o Recommended timeframe H / D Recommended markets Crypto, Equities, Indices
*win rate is calculated based off a risk reward ratio of 1 (1R)
Win rate (in %)*
Description
This indicator is based on an algorithm which provides accurate momentum tracking on every timeframe. It is visualized as colored candles and through some other tools. It includes
Overbought and oversold fixed areas. Their purpose is to facilitate the recognition of areas where the trend is likely to end or cool down. They are also marked with a background coloring. Zero line. It typically represents a change of trend when the price crosses under or over it. Volume shifts. Colored arrows will appear whenever a volume change is detected. How to use?
Buy/Long on a blue confirmation arrow Sell/Short on a red confirmation arrow Take profit when the indicator starts showing a blue background Take profit when the indicator starts showing a red background
extra tip: the zero line often acts as support / resistance similarly to the overbought and oversold areas Who is this for? o o Recommended timeframe M / H Recommended markets Crypto, Forex, Equities, Indices
*win rate is calculated based off a risk reward ratio of 1 (1R)
Win rate (in %)*
Description
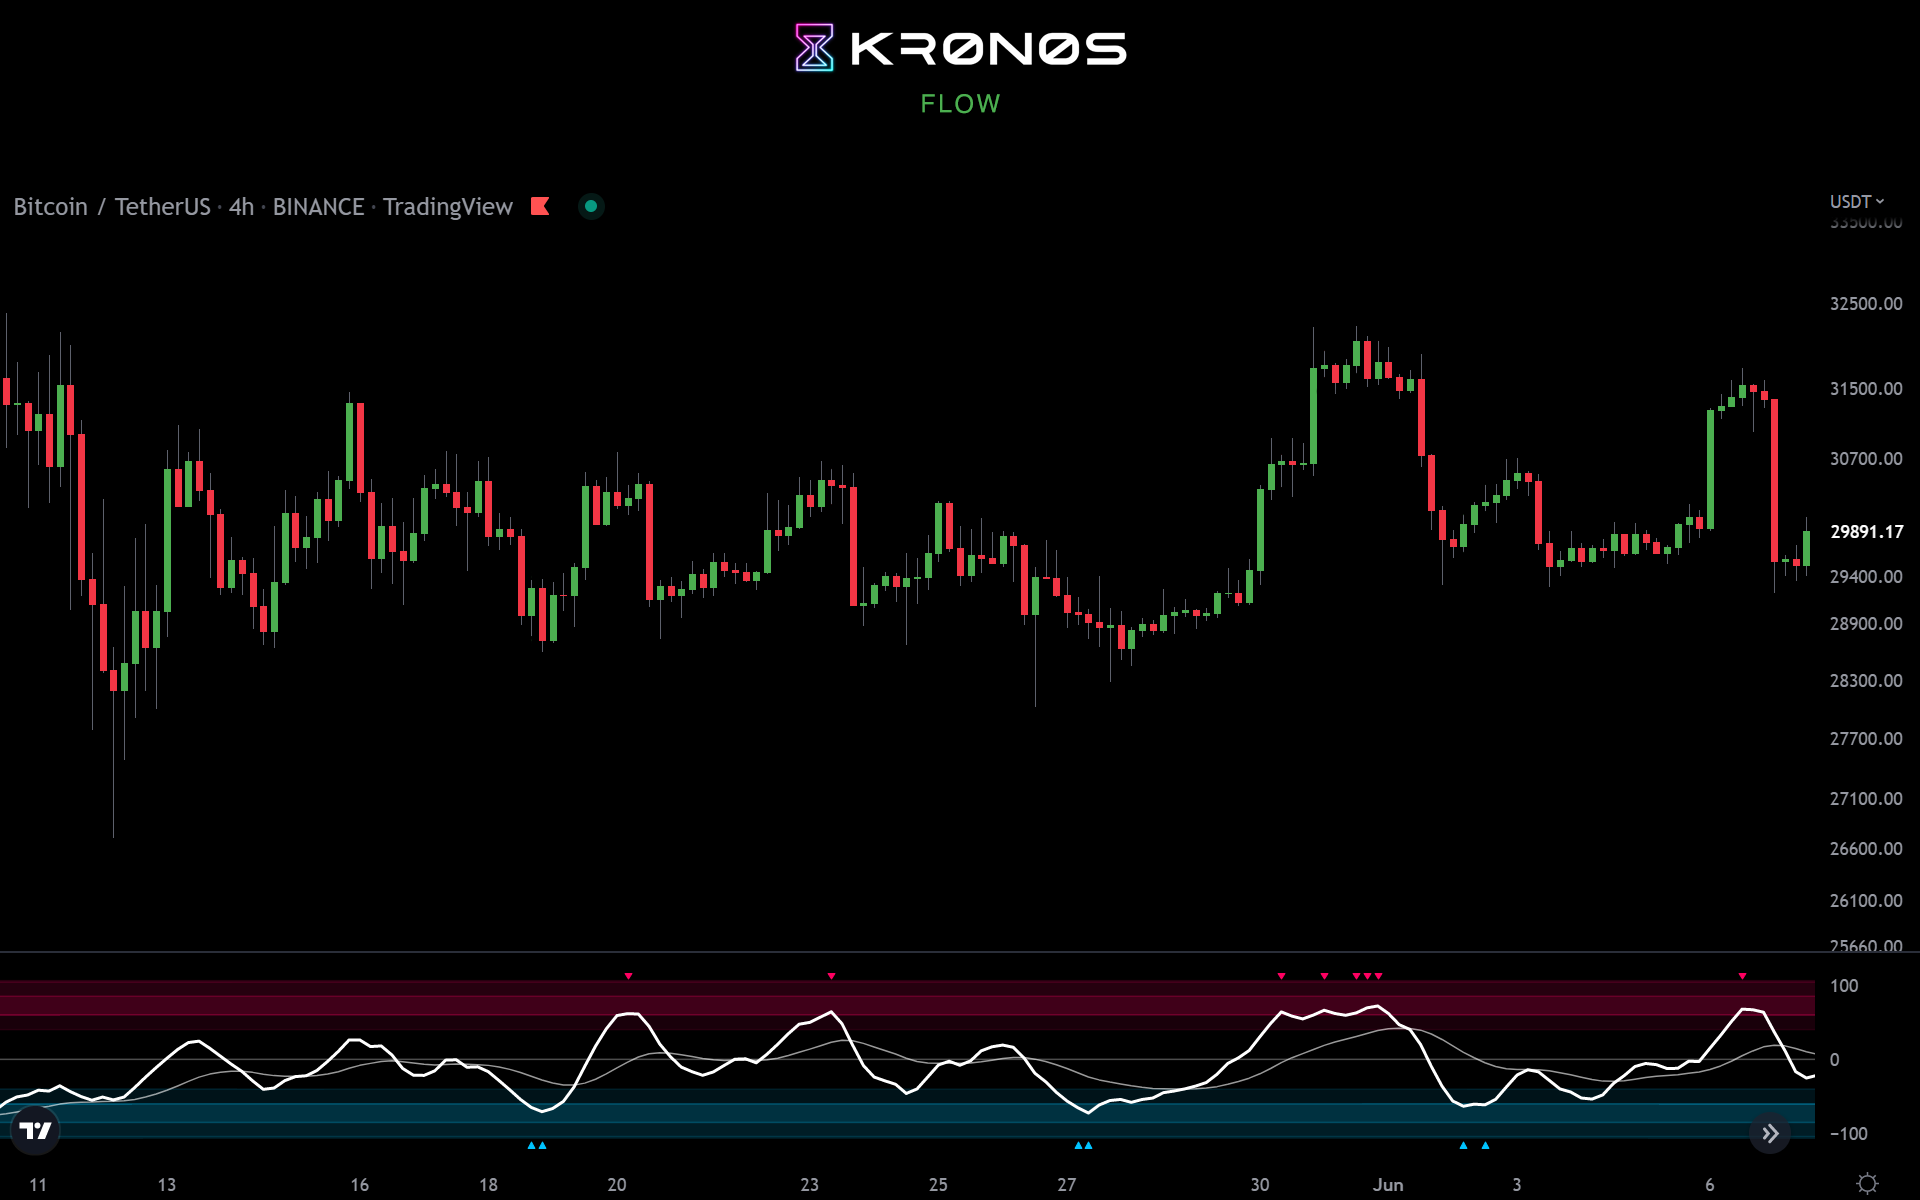
The main indicator component is a white signal line calculated from the price and strength of the current market pair filtered using the Fourier transformation formula (by Joseph Fourier). It includes
Trend confirmation. The grayish line is the signal line moving average which can either be used as a support/resistance line or as a strong trend confirmation in the case of a crossover/crossunder. Oversold and overbought areas. These areas are marked with multiple hues of red and blue color for them to be more easily noticeable. Extreme areas. Arrows around extreme areas are showing points where a reversal is very likely to occur. How to use?
Buy/Long on a blue arrow (or after a crossover if you want more confirmations) Sell/Short on a red arrow (or after a crossunder if you want more confirmations)
extra tip: use the zero line and overbought/oversold areas as a take profit area and place your stop loss at the previous swing low. Who is this for? o o / o o o Recommended timeframe M / H Recommended markets Forex, Equities, Indices
*win rate is calculated based off a risk reward ratio of 1 (1R)
Win rate (in %)*
Description
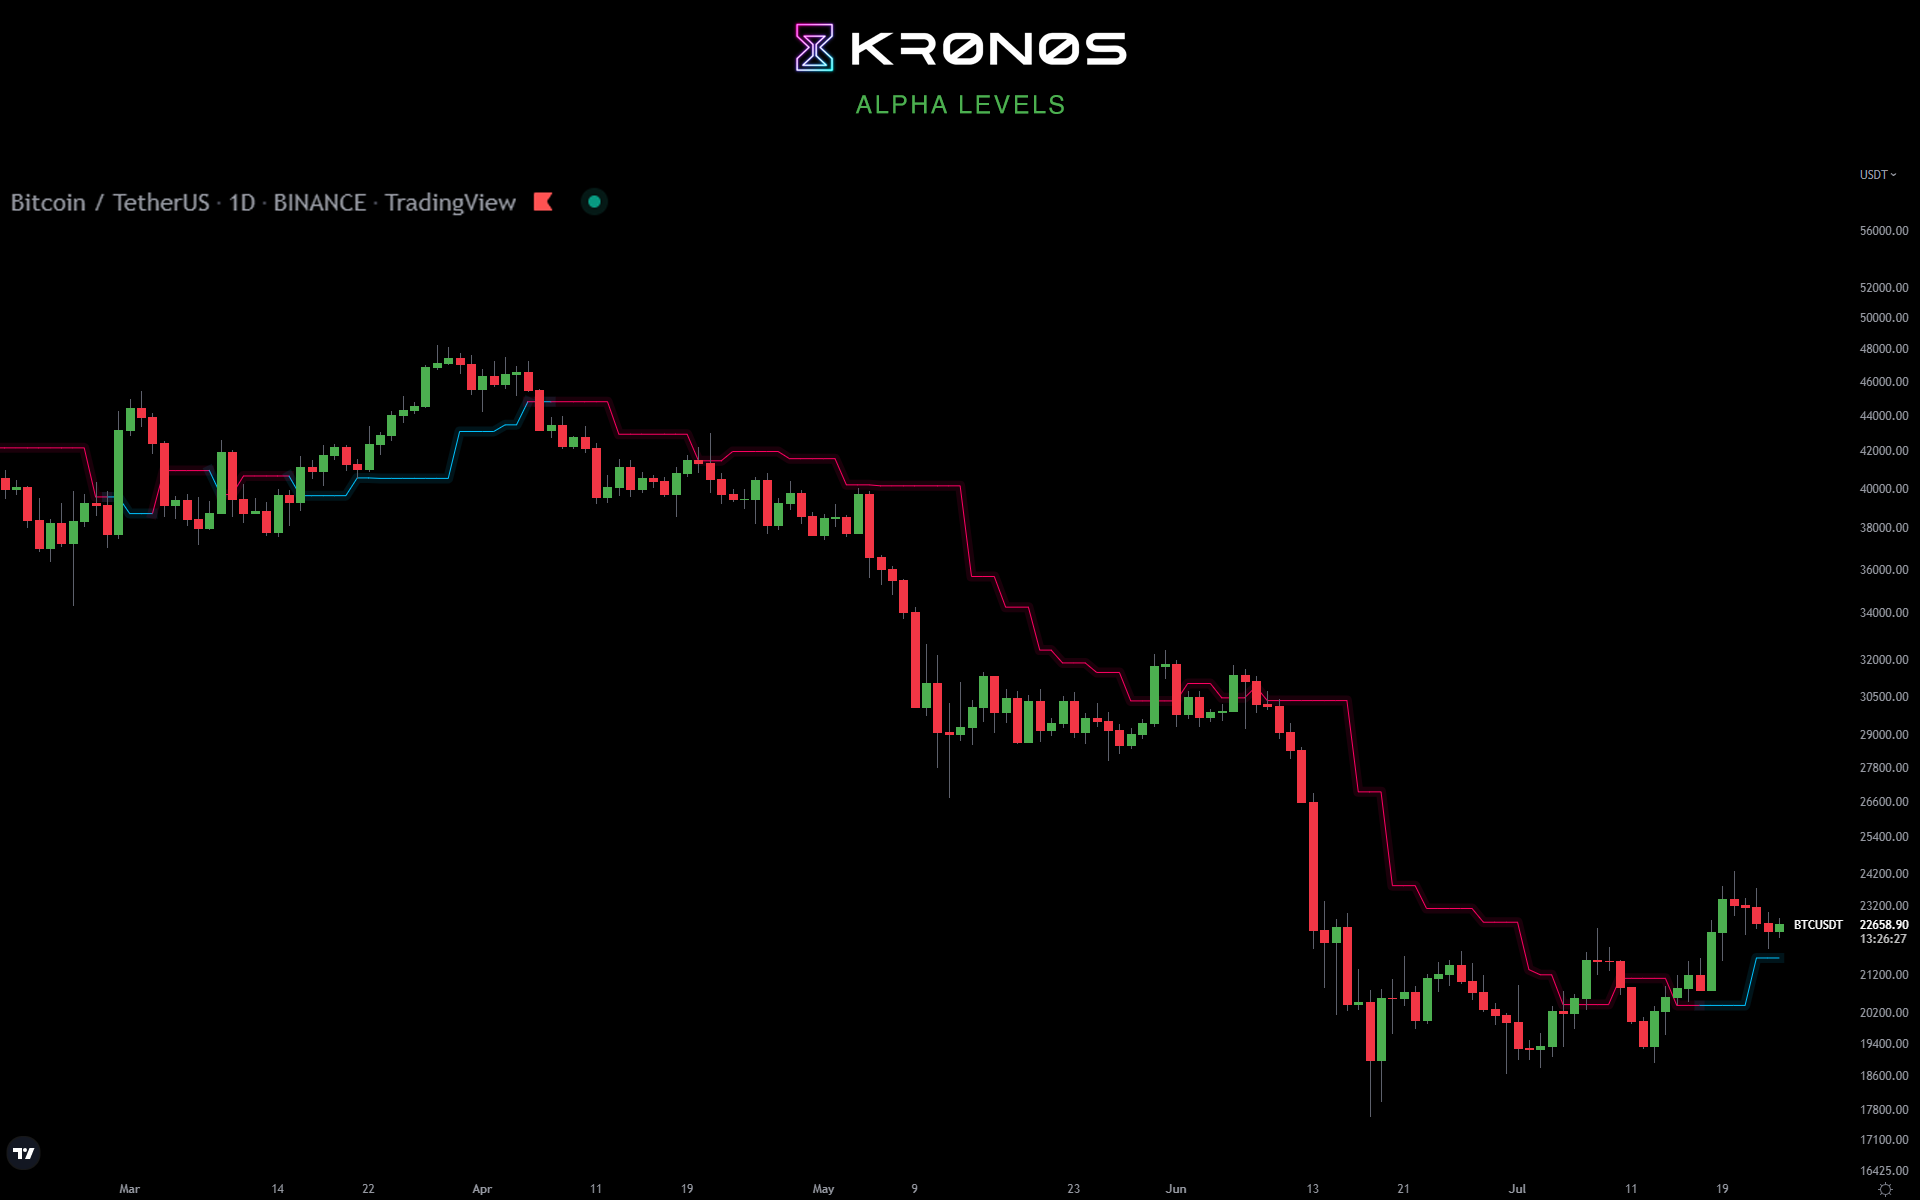
This indicator provides dynamic support and resistance levels for any market pair. Using it will make setting limit orders or stop losses a piece of cake. It includes
S/R line with band. This is used to determine where the current supply and demand levels are located: if the line is blue then it acts as support. Opposite for red. How to use?
Buy/Long when the indicator line is blue and price is retesting it. Sell/Short when the indicator line is red and price is retesting it.
extra tip: the line can be also used for stop loss and take profit areas. Who is this for? o o Recommended timeframe H / D Recommended markets Crypto, Forex, Equities, Indices
*win rate is calculated based off a risk reward ratio of 1 (1R)
Win rate (in %)*
Description
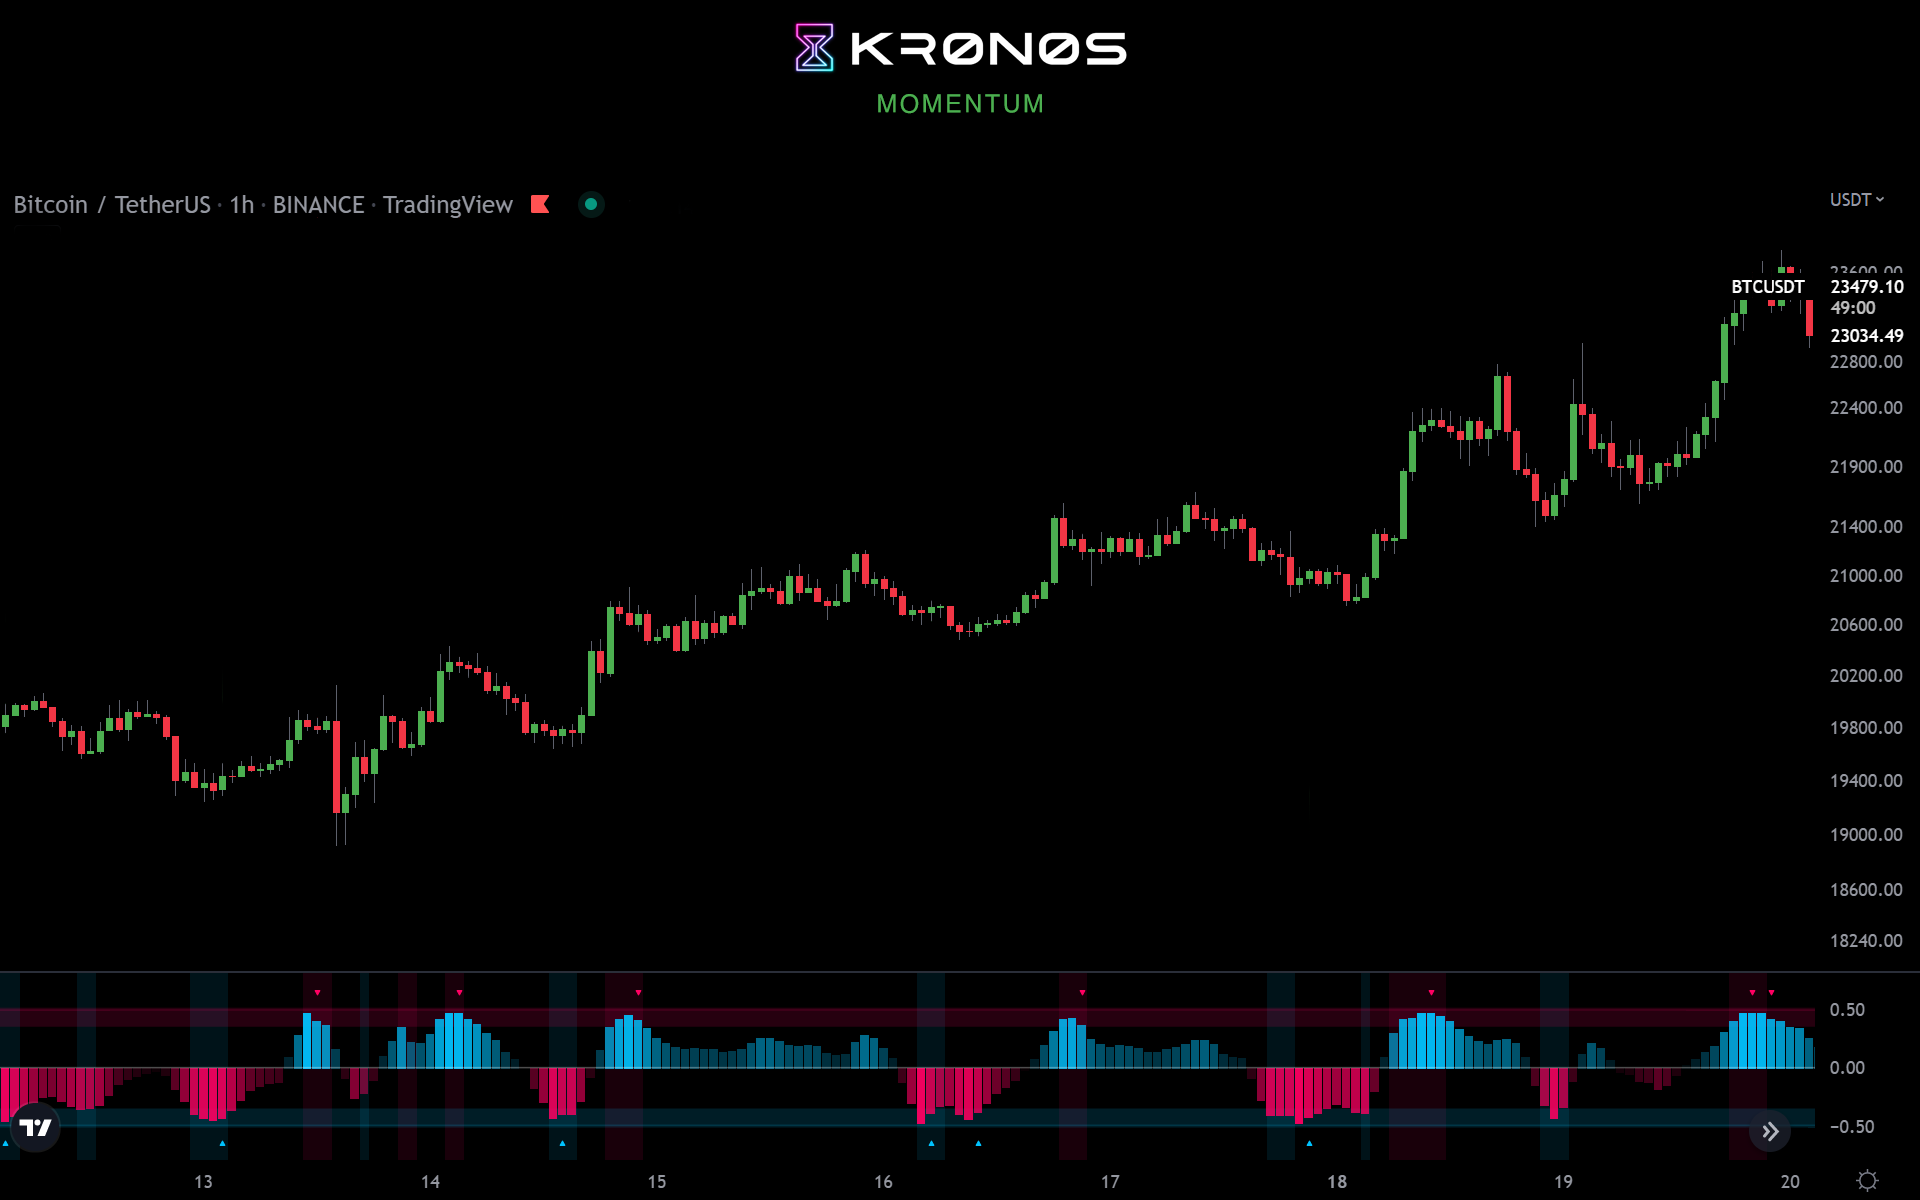
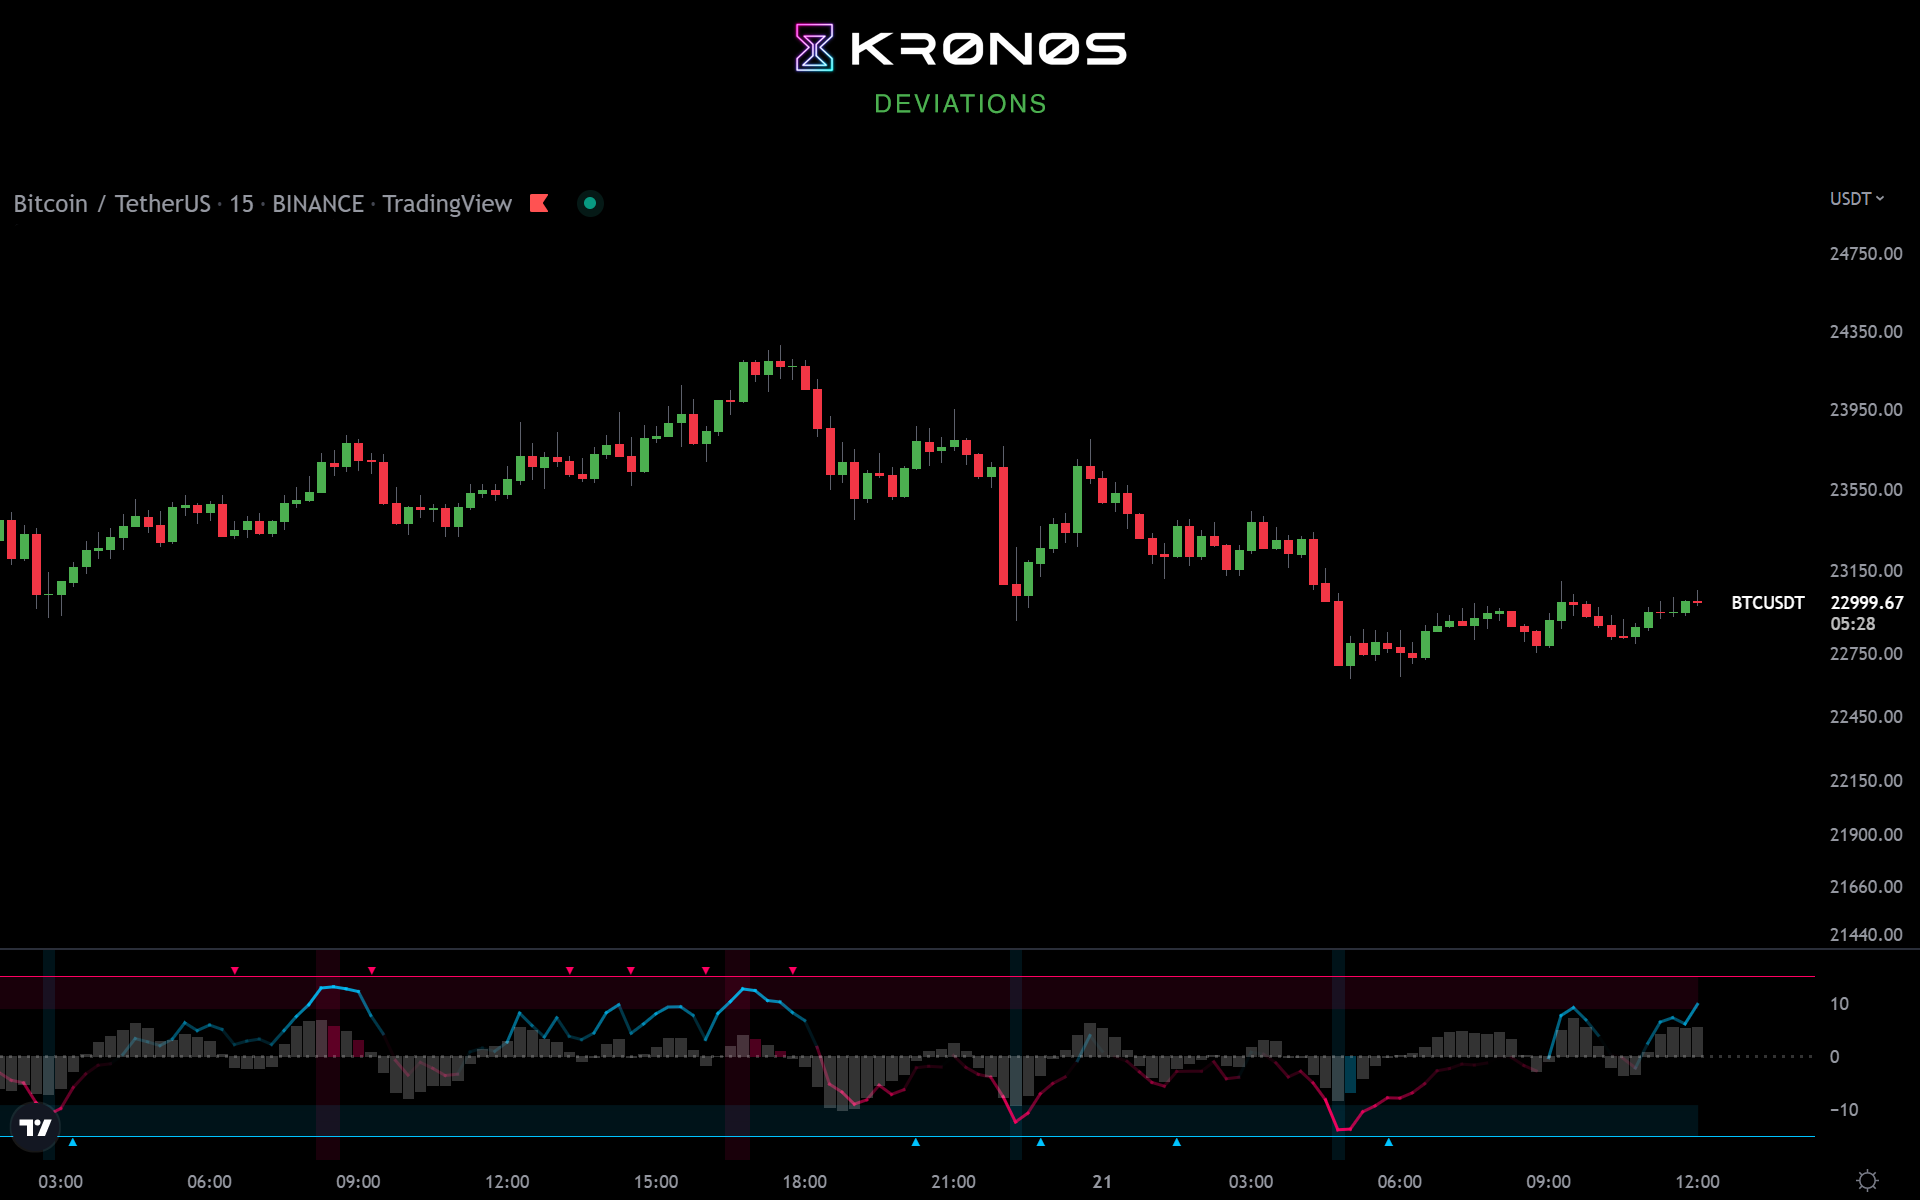
This indicator calculates the differences between the current price and the local support or resistance, and normalizes it into a range. It includes
Extreme zones. This value appears as blue and red lines which deviates from the oversold to overbought range. Momentum. Lower time frame momentum is represented by a gray histogram as well as a signal line oscillating from a red to blue color. Strong reversal. Red (bearish) and blue (bullish) columns will appear on the histogram when our algorithm detects that the strength of momentum is coming to an end indicative of a trend reversal. Trend confirmation. Red or blue arrows will act as a trend confirmation. Support and resistance. The zero line will frequently serve as a S/R area. Divergences. You can use this indicator to detect potential pivot areas. How to use?
Sell/Short when the histogram shows a red column and the signal line is in or above the overbought area (colored in red). Buy/Long when the histogram shows a blue column and the signal line is in or below the oversold area (colored in blue).
extra tip: if you entered a trade based on the above conditions, you can partially increase your position each time you see a confirmation arrow. Who is this for? o o o Recommended timeframe M / H Recommended markets Forex, Equities, Indices
*win rate is calculated based off a risk reward ratio of 1 (1R)
Coming soon.
o Investor
o o Beginner trader
o o o Advanced trader
M Minute (scalping)
H Hourly (swing trading)
D Daily
compatible with TradingView